Deploying network enabled sensors based on ESP32, ESP8266, and Raspberry Pi requires a way to monitor them. I’ll describe how to implement this, using InfluxDB and Grafana.
Logs stored on the devices and serial based logging are not valid options. Some of the sensors sit in inaccessible placed. Generally it’s impractical to physically having to go to the sensor to determine its health.
Inspired by the article Writing Logs Directly to InfluxDB I decided to do something similar. The devices must post log messages to InfluxDB and I will use Grafana to implement data presentation. This way I’ll be able to monitor and filter logs of all devices in my network – even remotely.
InfluxDB
I already have an InfluxDB running. Check out Collect, Present, Alert on how to set it up. Add an entry to the config file to allow UDP access to a new database:
[[udp]]
  enabled = true
  bind-address = ":65001"
  database = "syslog"
  retention-policy = ""
  batch-size = 5000
  batch-pending = 10
  read-buffer = 0
  batch-timeout = "1s"
  precision = ""
ESP32 and ESP8266 Implementation
Initially this implementation aims at my existing ESP32 and ESP8266 project AirPatrol. For that project I already have a data Publisher component and I’ll extend that to support logging.
The code for the publisher is under ESP8266, BME280, CCS811 Sensor Build. Below is the function I’ll expand it with. The InfluxDB line interface is used. I’ll not use SysLog format like in the article I mentioned. But I’ve take inspiration from that and are logging the following parameters:
- Timestamp – automatically added by InfluxDB.
- Current IP address.
- Hostname of the device – e.g. Chase.
- Severity level description – e.g. error or warning.
- MAC address of the device.
- Message to log.
- Severity code – a numerical representation of the severity level.
- Version number of the software running on the device.
In the code below these values goes in a measurement called airpatrol in a database called syslog.
/***************************************************/bool publisher_sendSyslog(uint8_t lvl, String msg) {
bool result = true;
if (WiFi.status() != WL_CONNECTED) {
result = publisher_init();
}if (true == result) {
String sevDesc = "debug";
switch (lvl) {
case SYSLOG_EMERGENCY:
sevDesc = String("emergency");
break;
case SYSLOG_ALARM:
sevDesc = String("alarm");
break;
case SYSLOG_CRITICAL:
sevDesc = String("critical");
break;
case SYSLOG_ERROR:
sevDesc = String("error");
break;
case SYSLOG_WARNING:
sevDesc = String("warning");
break;
case SYSLOG_NOTICE:
sevDesc = String("notice");
break;
case SYSLOG_INFO:
sevDesc = String("info");
break;
default:
/* Debug */break;
}uint8_t mac_raw[6];
char mac_str[19];
WiFi.macAddress(mac_raw);
snprintf( mac_str, sizeof( mac_str ), "%02X:%02X:%02X:%02X:%02X:%02X", mac_raw[ 0 ], mac_raw[ 1 ], mac_raw[ 2 ], mac_raw[ 3 ], mac_raw[ 4 ], mac_raw[ 5 ] );
Serial.println(String(sevDesc) + ": " + String(msg));
String log = "airpatrol,ip=" + String(WiFi.localIP().toString().c_str()) + ",hostname=" + String(HOST) + ",severity=" + String(sevDesc) + ",macaddr=" + String(mac_str) + " message=\"" + String(msg) + "\",severity_code=" + String(lvl) + ",version=" + String(VERSION);
udp.beginPacket(DB_HOST, DB_SYSLOG_PORT);
udp.print(log);
udp.endPacket();
}return result;
}
Grafana
In Grafana I added a Dashboard where I present the log. I covered how to setup Dashboards in Collect, Present, Alert.
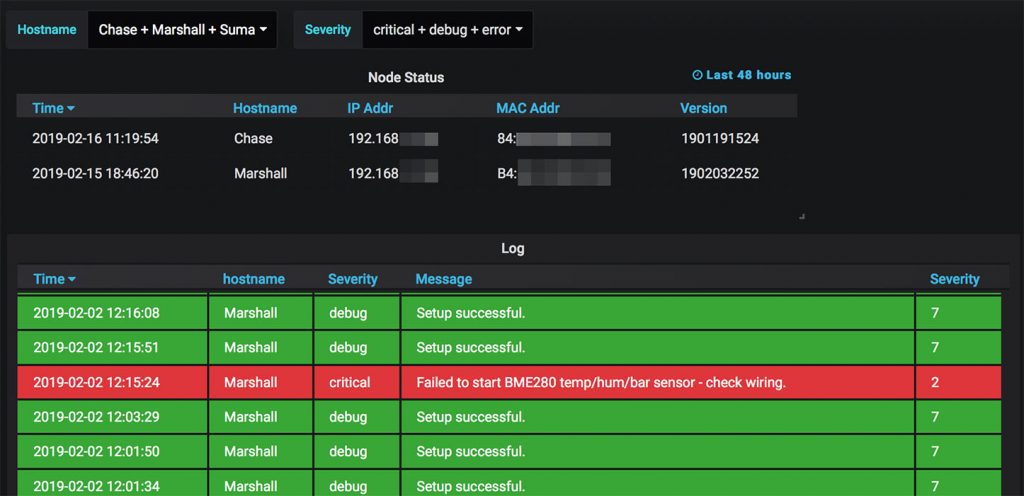
The Dashboard I use has the log in a table at the bottom. Above that is a list of devices that has logged anything within the last 48 hours. These devices are presented with the most recent IP address, MAC address, and version they have reported. Finally at the top are two selection fields where the log can be filtered by device and by log severity.
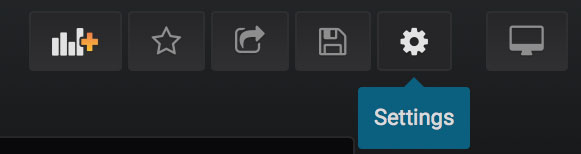
To setup these selection fields enter the Settings menu of the Dashboard.
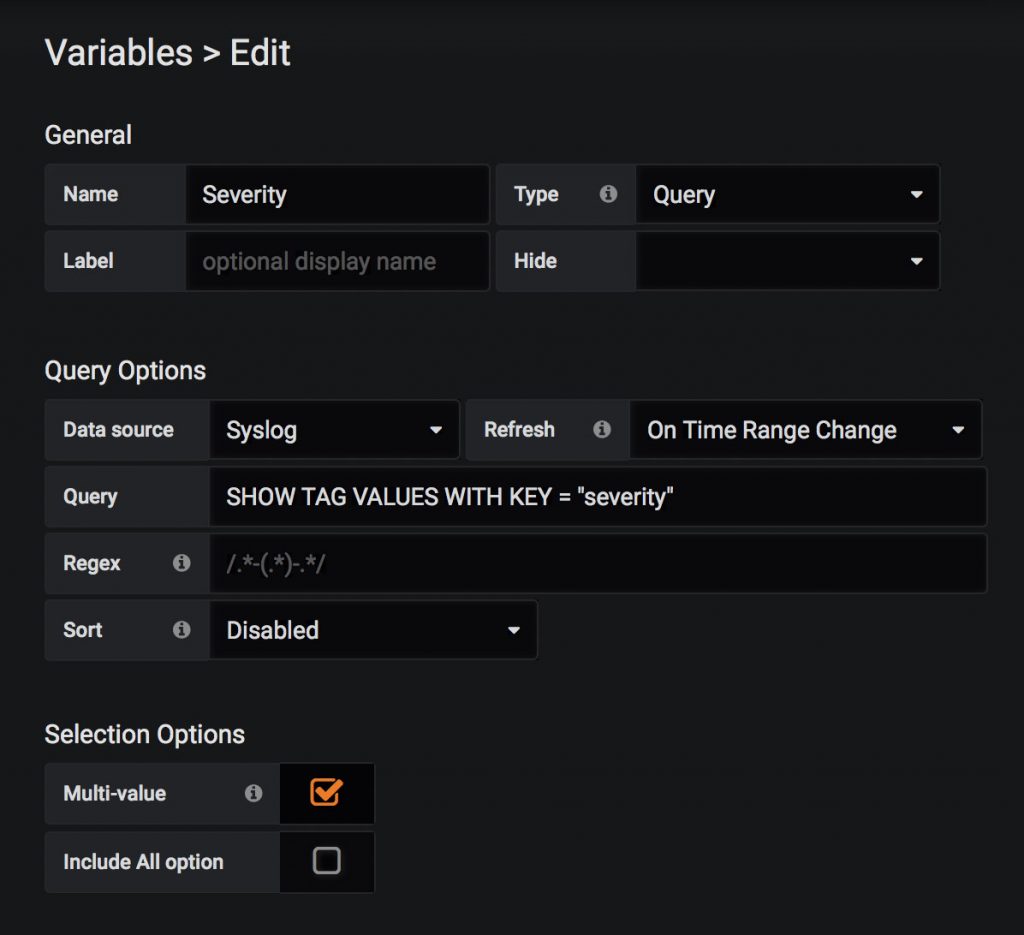
In the sidebar select Variables and add a new one.
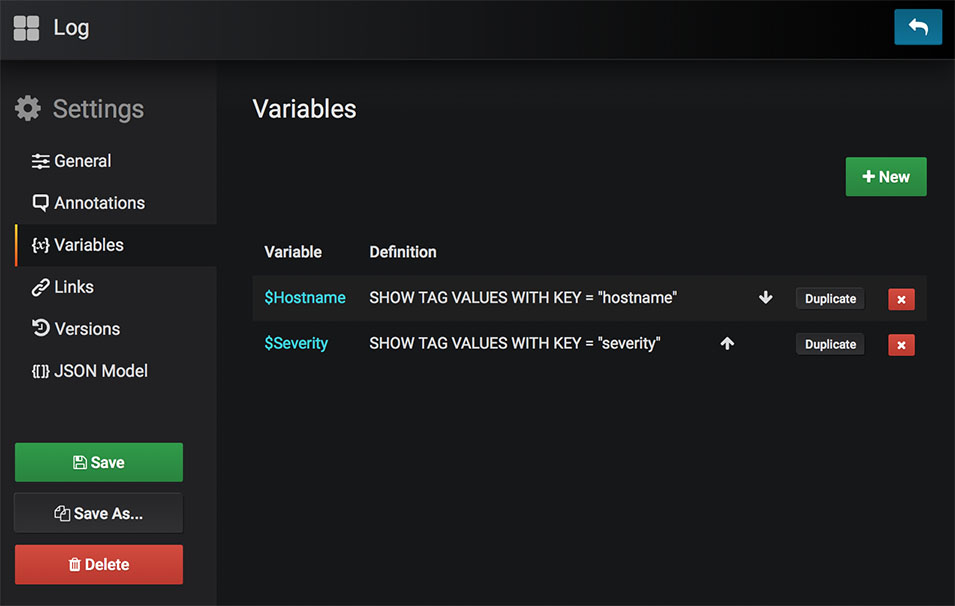
Set up the selection criteria for the variable. In this example I want the different values of severity. InfluxDB operates with Tags and Fields for storing data, which has to do with how data is indexed. Only Tags can be Variables.
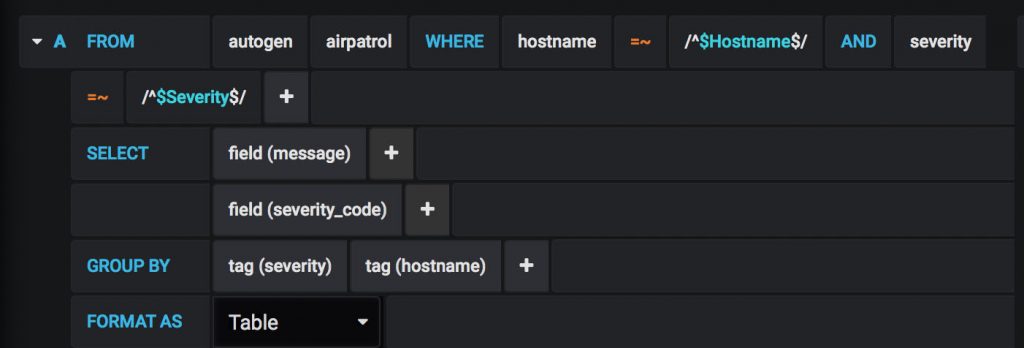
When the Variables are set up they can be references on the dashboard panel configurations. The variable fields will automatically appear when the variables have been set up. And the panels will filter appropriately when the variables are used in the WHERE clause. Also, note the GROUP BY tags.