Below I’ll describe how I’ll setup Docker, InfluxDB, Grafana, and Slack to easily implement data collection, presentation, and event alerts from a sensor. The need for this setup comes from the requirements for AirPatrol where I describe that I want to have an easily accessible data presentation. To achieve this I’ll use Docker to setup an InfluxDB database for collecting data. Then I’ll use Docker again to run Grafana as a web interface for data presentations. Finally, I can set all of this up to generate push notifications for my phone on alert events with a minimal effort using Slack.
Data Collection with InfluxDB
Each sensor array collects data from the individual sensors at some interval. Some sensors each minute and some at a lower frequency.
InfluxDB is a time series database which is specifically intended to store data that evolves over time and all entries are stored with a timestamp. If one is not provided on submission then the database will automatically timestamp the data. This exact feature is utilised in AirPatrol as none of the sensor arrays have real time clocks and thus does not know the time.
The database is setup on a central server to silently collect data from an UDP port. This way the sensor arrays only need to know the address of the database and does not need to handle two-way database communication. Data is sent in a fire and forget fashion. This approach keeps the design simple and limits dependencies between sensor arrays and data collection.
InluxDB runs in a Docker container with the data itself stored outside the container in order for it to persist if the container was to be restarted.
Starting InfluxDB
Below is the command I use to start the InfluxDB Docker container. After that all the options of the command are listed and explained.
docker run -d --restart always --name influxdb -p 8086:8086 -p 65000:65000/udp -v $PWD/influxdb.conf:/etc/influxdb/influxdb.conf:ro -v $PWD:/var/lib/influxdb influxdb:1.X.Y -config /etc/influxdb/influxdb.conf
These are the options for the Docker container.
-dRun as daemon.--restart alwaysAutomatically restart on boot and if closed.--name influxdbAssign a convenient name.-p 8086:8086Open port 8086 for control and data access locally – e.g. by Grafana.-p 65000:65000/udpOpen UDP on port 65000 to allow writing data to a database – see configuration below.-v $PWD/influxdb.conf:/etc/influxdb/influxdb.conf:roMount configuration file in the container as read-only – allows me to keep the configuration under version control and to keep the configuration if the container is shut down.-v $PWD:/var/lib/influxdbMount current directory as where the data in the database should be stored. If this was omitted then all collected data would be lost if the container was shut down or restarted.influxdb:1.X.YUse a specific version of the influxdb image. I don’t have any particular grievenses with any one version, I just like to have control of when versions are updated in my setup so I can take care of any changed APIs or similar. Replace X and Y with the version number you want.-config /etc/influxdb/influxdb.confPoint the InfluxDB to start up with the configuration file mounted previously.
For the above configuration to work the UDP port will have to be mapped to a database in the InfluxDB config file. Add this section to the config file.
[[udp]]
  enabled = true
  bind-address = ":65000"
  database = "mydata"
  retention-policy = ""
  batch-size = 5000
  batch-pending = 10
  read-buffer = 0
  batch-timeout = "1s"
  precision = ""
Controlling InfluxDB
To control the InfluxDB when the Docker container is running you can attach to it using the command below. Check out the documentation from InfluxData for details on how to control InfluxDB.
docker exec -it influxdb influx
InfluxDB will auto-create the database if it does not exist when starting to pour data into it through the UDP port. However, it is also super easy to create it manually:
create database mydata
Use exit to exit from the container – this will leave the container and database running.
Stopping InfluxDB
As the container is started with --restart always this needs to be disabled before the container can be stopped. Use the following commands if you need to stop and optionally remove the container – e.g. if a new configuration needs to be installed and InfluxDB thus restarted.
docker update --restart=no influxdb
docker stop influxdb
docker container rm influxdb
Data Presentation with Grafana
Grafana is a web based graphing tool that can present data from multiple data sources. Dashboard can be setup in a highly configurable manner to present the data exactly how you want it. Grafana works perfectly with InfluxDB. An alternative that would have worked just as well is Chronograf.
Starting Grafana
Grafana is also available as a Docker image so I’ll fire that up in a Docker as well with the command below. Many of the options are repeats of those from InfluxDB so I’ll not go into details about the again.
ID=1000
docker run -d --restart always -p 3000:3000 --name=grafana --user $ID -v $PWD:/var/lib/grafana -e "GF_SECURITY_ADMIN_PASSWORD=1234" grafana/grafana:5.X.Y
In a web browser open Grafana e.g. by going to http://localhost:3000 and login with user admin and the password specified in the Docker command above.
Add Data Source
The Grafana interface will take you through the initial setup and adding of Data Source. You will need to make Grafana able to connect to the InfluxDB. A quirk here is that we started InfluxDB in a Docker container and Docker is using a network bridge when different Docker containers have to communicate. Thus, we’ll have to use the IP address the InfluxDB Docker container has received in the bridge to access it and not localhost. Use this command to find the IP and use that when adding data source in Grafana:
docker inspect influxdb | grep "IPAddress"
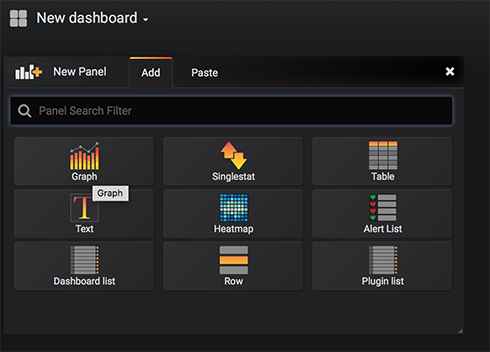
Create Dashboard
When Grafana is up and running create a new dashboard. Dashboards can be populated with different panels – graphs are often a good bet – at least when presenting environmental data like temperatures.
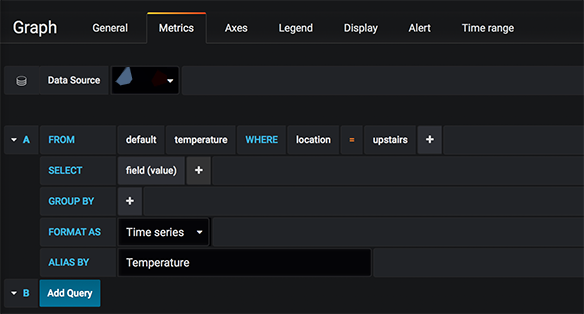
Set the data source and construct the query that gets the data that needs to be presented.
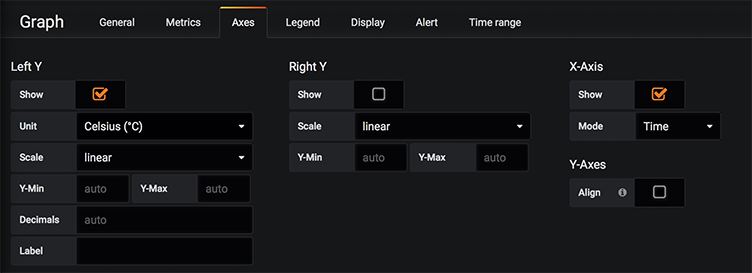
Going to the Axes tab allows you to set the unit of the data. Grafana allows all kinds of manipulations to data and options for presentation. It is somewhat intuitive and the help available online is pretty substantial so play around and search for whatever you need.
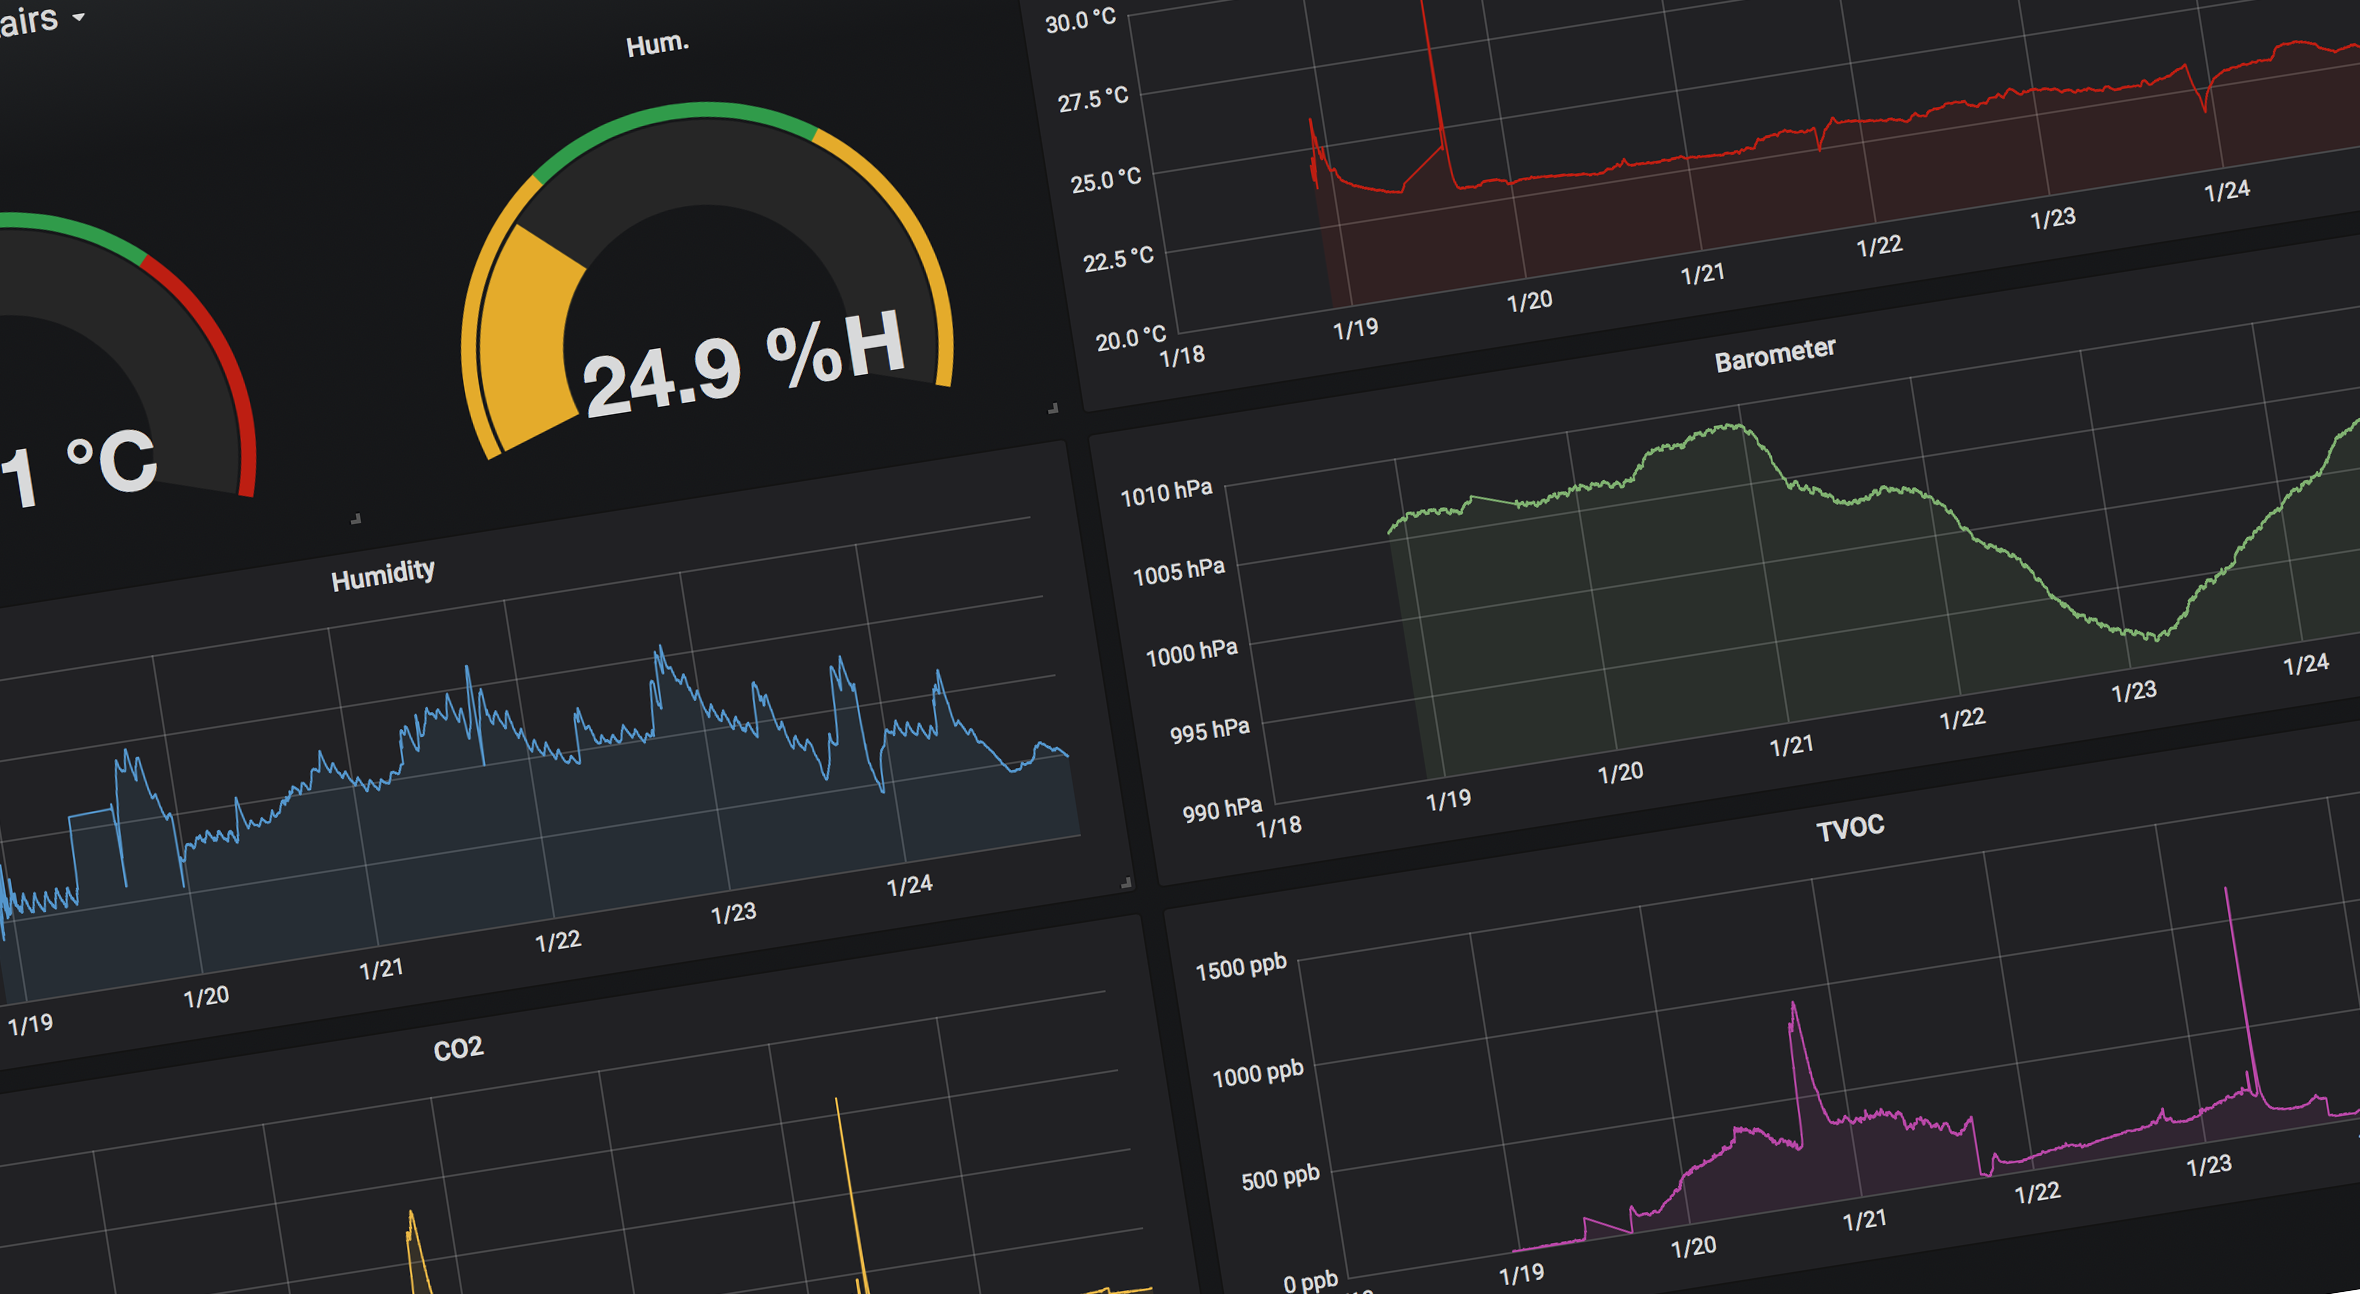
Below is the complete dashboard that I setup for one of the sensor arrays in AirPatrol.
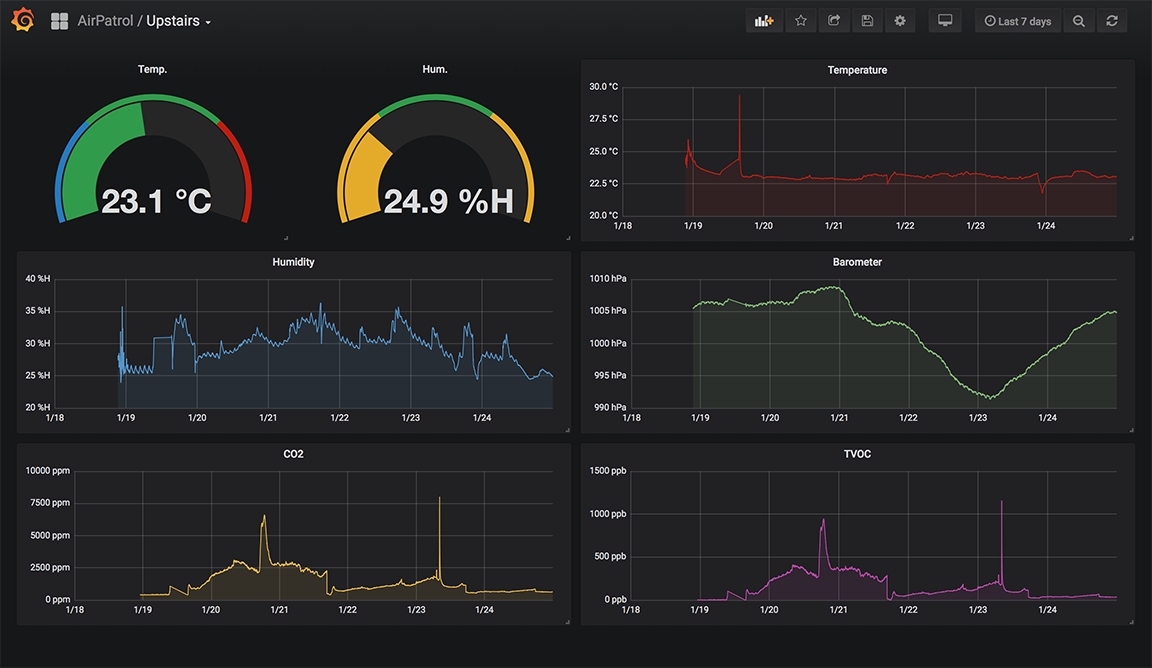
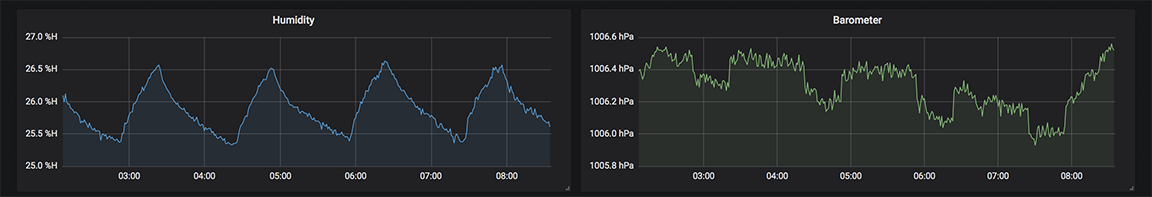
Never underestimate the power of visual data exploration. When plotting the data I discovered the frequency at which my air conditioning system runs. This is very evident from both the barometer pressure and the humidity.
Prepare Slack for Alerts
In the past I would probably have dived into a huge project of building an app for my phone that could generate alarms when something event occurred. Within recent years I’ve take on a more path of least resistance approach. In that spirit I’ll use Slack as comes with a range of benefits:
- It has both web interface and phone app for both Android and iPhone.
- It can generate push notifications on the phone.
- Multiple users can get the same alarms.
- Grafana has alarm generation on Slack already integrated.
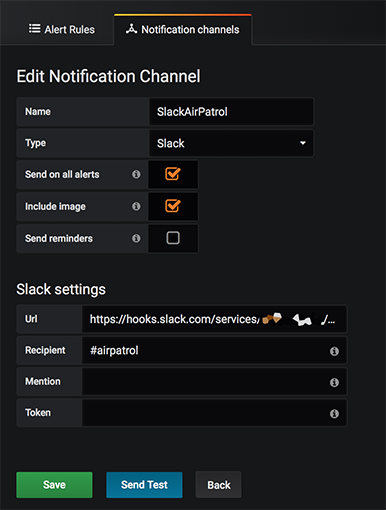
I setup a channel called #airpatrol on my Slack workspace in order to group incoming alarms. Then I need to create a Service which can receive the alarms from Grafana and post them to the channel. To create a service follow this path of breadcrumbs:
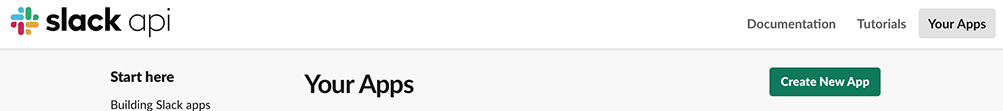
Click on user name -> Administration -> Manage Apps -> Build -> Your Apps -> Create New App
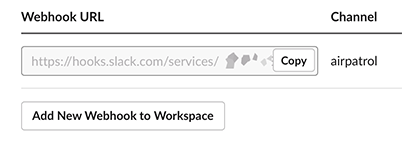
Then follow the guide to setup the service. When the service is created you’ll need a webhook for Grafana to post alarms. From the services Basic Information page under Features in the sidebar click Incoming Webhooks and then click on the button Add New Webhook to Workspace. When the webhook is created then copy it.
Add Alerts to Grafana
In Grafana click on the Bell icon in the sidebar and select Notification channels and then click the + New Channel. Set the channel type to Slack and paste the webhook from Slack into the URL field and type in the Slack channel to receive the alarms.
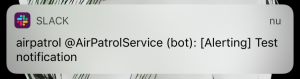
Grafana is now able to post alarms to Slask. Using the Send Test will verify this and if Slack is installed on your phone also verify that Push Notifications are working as intended.
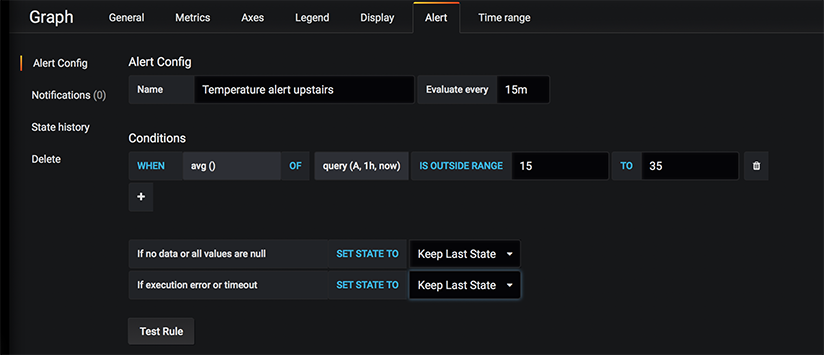
The specific alarms are setup under the individual graphs on a Dashboard. Go into the Edit mode of a graph and click on Alert. Add an Alarm Configuration and enter the parameters. In the example below I want to be notified if the temperature in my house goes outside of the range between 15 degrees C and 35 degrees C average over 30 minutes and evaluated every 15 minutes.
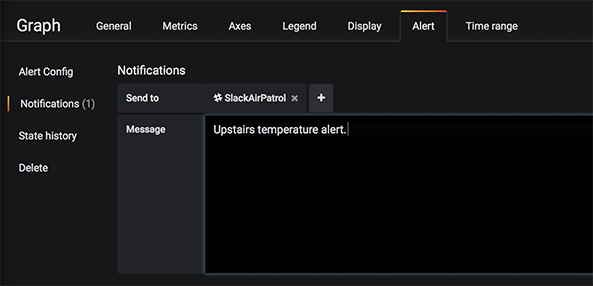
I then setup the notification for that alert to point to the Slack channel I just setup.
With this in place the whole chain of data collection, data presentation, and alerting is completed and ready for data from the AirPatrol sensors.